
Eelgrass distribution increased between 2017 and 2019 from 1,547 to 1,678 acres, with increases in most of the 13 assessment zones, with the exception of the Atlantic Coast (just outside Wentworth Harbor), Spinney Creek, and Sagamore Creek. By far the biggest percentage increase was seen in Little Bay, which saw eelgrass acreage increased by 566%. The full report can be found at: https://scholars.unh.edu/prep/438/.
Greatest gains are seen in Little Bay, which expands from 3 acres to 20 acres. Great Bay expands from 1,362 acres to 1,450 acres.
Compared with recent years, the amount of eelgrass in 2019 is close to what was reported in 2013 (1,684 acres) as well as 2016 (1,689 acres). The peak amount of eelgrass in recent years was in 1996 when 2,900 acres were mapped.
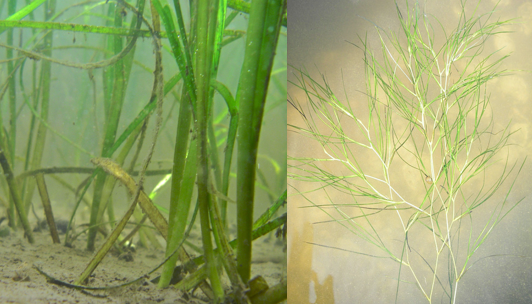
Another important result noted in the report is the significant amount of widgeon grass (Ruppia maritima) in the system. In total, 147 acres of widgeon grass were reported, most of it in the Great Bay, with smaller amounts in Spinney Creek and the Winnicut River. In addition, 107 acres were mapped as both widgeon grass and eelgrass mixed together. Widgeon grass is similar to eelgrass but smaller, more branched, and does not have as much below ground biomass.
While widgeon grass has been reported previously, it has not been consistently mapped because it is more ephemeral (i.e., lasting for a short time) than eelgrass. However, in estuaries to our south, widgeon grass has increased in dominance and consistency, perhaps due to its higher tolerance of warmer waters. Therefore, future eelgrass mapping efforts will not widgeon grass distribution as well.
These results are reported while EPA and municipalities within the Piscataqua Region watershed discuss how best to reduce nitrogen, both from point sources (e.g., wastewater treatment facilities) and from non-point sources (e.g., stormwater runoff). Research indicates that, worldwide, excess nitrogen as well as sediments - both associated with increased development - are the main causes of eelgrass loss or decreased ability to recover from episodic events, such as major storms. Warming waters constitute another common stressor on eelgrass. In fact, warming waters and excess nutrients compound each other, because increased water temperatures force eelgrass to respire more, which requires more light. However, excess nitrogen has the potential to reduce light through increased phytoplankton, epiphytes (algae growth on eelgrass blades) and seaweed, which can shade out eelgrass beds.
Data suggests that seaweed abundance increased from 8% cover to greater than 20% cover at monitoring sites between 1980 and 2009, although little consistent monitoring was done between those dates. Since 2103, seaweed monitoring has occurred annually and sub-tidal seaweed monitoring began in 2018. Phytoplankton monitoring has occurred at monthly intervals; however, it is acknowledged that more frequent monitoring is required to better understand changes in phytoplankton abundance. Epiphytes have not been consistently measured in the Great Bay Estuary.
The PREP Technical Advisory Committee is developing a new Integrated Research and Monitoring Plan, which should be completed in the first half of 2021. This new plan will specify recommendations for better understanding changes in phytoplankton, epiphytes, as well as other important information such as number of reproductive shoots and viability of eelgrass seeds and seedlings. Increasing evidence points to the importance of understanding reproductive success as a critical component in the recovery of eelgrass ecosystems. Questions about this new plan should be directed to PREP Coastal Scientist, Kalle Matso.